

According to the Central Administration of Statistics (CAS), monthly inflation in Lebanon, as captured by the change in the consumer price index (CPI), stood at a mere 0.01% in August 2019, compared to a negative 0.46% in the previous month. On an annual basis, however, Lebanon’s CPI rose by 1.22% to 108.51 in August of the current year, from 107.20 a year before. In details, the index portrays a 12.14% annual hike in the prices of clothing & footwear (5.2% weight in the index), a 0.58% increase in the prices of food & non-alcoholic beverages (20.0% weight in the index), a 5.08% surge in education prices (6.6% weight in the index), and a 1.42% appreciation in the prices of housing - owner occupied (13.6% weight in the index), only to name a few. On the other hand, the prices of housing – water, electricity, gas and other fuels (11.8% weight in the index) fell by 3.27% on a yearly basis, accompanied by a 1.27% contraction in transportation prices (13.1% weight in the index), a 0.23% drop in healthcare prices (7.7% weight in the index), and a 0.65% decrease in communication prices (4.5% weight in the index). The following section captures the fluctuation in the key constituents of Lebanon’s consumer basket:

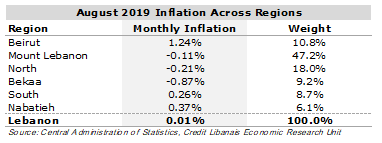
On a geographical basis, the Beirut (1.24%), Nabatieh (0.37%), and South (0.26%) regions witnessed a monthly appreciation in their CPI values in August, with the Bekaa (-0.87%), North (-0.21%) and Mount Lebanon (-0.11%) regions depicting drops in their CPI values.
The following chart captures the evolution of the yearly change in CPI values since December 2011:

تُظهِر الإحصاءات الصادرة عن إدارة الإحصاء المركزي إرتفاعاً شهريّاً صغيراً بنسبة 0.01% في مؤشِّر أسعار الإستهلاك في لبنان خلال شهر آب 2019، مقارنةً بإنخفاض بلغ 0.46% في تمّوز. أمّا على صعيدٍ سنويٍّ، فقد سَجَّلَ مؤشِّر تضخُّم الأسعار زيادةً نسبتها 1.22% ليصل إلى 108.51 في الشهر الثامن من العام الحالي، مقابِل نتيجة 107.20 في الشهر ذاته من العام السابق. ويأتي ذلك نتيجة إرتفاع أسعار الألبسة والأحذية بنسبة 12.14% (تثقيل بنسبة 5.2%)، وتطوُّر أسعار المواد الغذائيّة والمشروبات غير الروحيّة بنسبة 0.58% (تثقيل بنسبة 20.0%)، وزيادة كلفة التعليم بنسبة 5.08% (تثقيل بنسبة 6.6%)، وإرتفاع أسعار المسكن - القيمة التأجيريّة للمالكين بنسبة 1.42% (تثقيل بنسبة 13.6%)، للذكر لا الحصر. في المقابِل، تراجعت أسعار المسكن المتعلّقة بالماء والغاز والكهرباء والمحروقات الأخرى بنسبة 3.27% (تثقيل بنسبة 11.8%)، ترافقاً مع إنكماش كلفة النقل (تثقيل بنسبة 13.1%) بنسبة 1.27%، وتدنّي كلفة الصحّة (تثقيل بنسبة 7.7%) والإتّصالات (تثقيل بنسبة 4.5%) بنسبة 0.23% و0.65% بالتتالي. تُظهر الفقرة التالية تقلّبات أسعار البنود في مؤشِّر أسعار الإستهلاك:

أمّا على صعيدٍ جغرافيٍّ، فقد شهدت كلّ من بيروت (1.24%) والنبطيّة (0.37%) والجنوب (0.26%) إرتفاعاً شهريّاً في مؤشِّر غلاء المعيشة خلال شهر آب 2019 فيما سجّلت مناطق البقاع (-0.87%) والشمال (-0.21%) وجبل لبنان (-0.11%) إنخفاضاً شهريّاً في مؤشِّر غلاء المعيشة.

يُظهِر البيان التالي التطوّر السنوي في مؤشِّر أسعار الإستهلاك منذ شهر كانون الأوّل 2011:

