


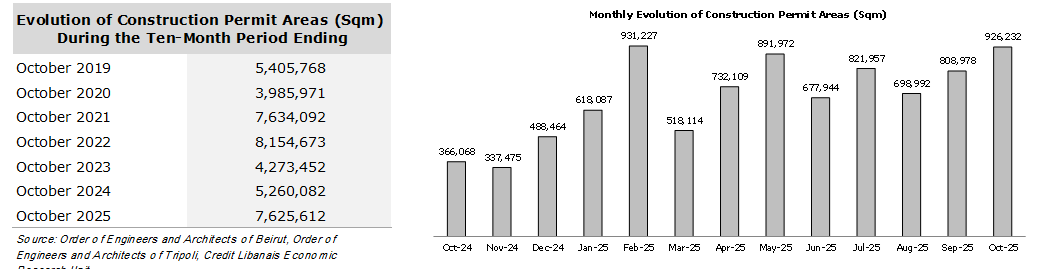
The surface area of construction permits in Lebanon, which reflects the level of future supply in the real estate sector, attained 926,232 sqm in October 2025 compared to 808,978 sqm in September and 698,992 sqm in August. October’s level represents the highest reading since the month of May 2022 (at a time when there was a rush for construction permits in anticipation of an increase in the related fees as a result of the devaluation of the Lebanese Pound), reflecting a solid future supply in the light of the improved security and economic situations. On a cumulative basis, moreover, the surface area of construction permits rose by 44.97% y-o-y in the first ten months of 2025 to just above 7.62 million sqm by end of October compared to around 5.26 million sqm in the same period last year. The monthly evolution of construction permit areas between the October 2024 – October 2025 period shows a rollercoaster trend as depicted by the chart below:
As far as the geographical distribution of construction permits is concerned, the Mount Lebanon region continued to control the lion’s share of the total surface area of issued permits (2.86 million sqm <37.48%>), followed by the North (1.62 million sqm <21.29%>), South (1.40 million sqm <18.37%), Bekaa (0.78 million sqm <10.28%>), Nabatieh (0.63 million sqm <8.26%>), and Beirut (0.33 million sqm <4.32%>) regions.
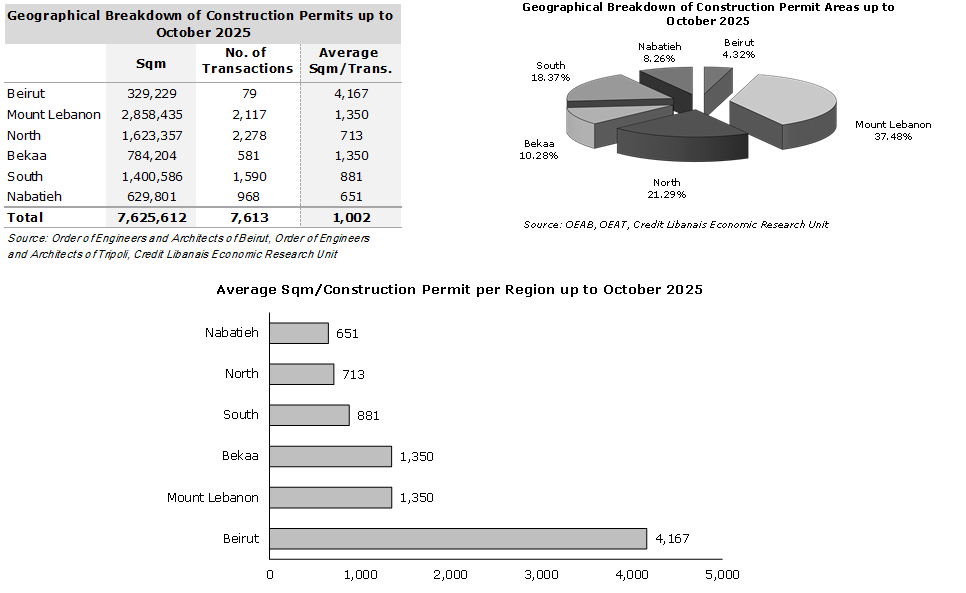
Beirut enjoyed the highest exploitation coefficient which stood at 4,167 sqm per construction permit YTD October 2025, followed by the Mount Lebanon (1,350 sqm/transaction), Bekaa (1,350 sqm/transaction), South (881 sqm/transaction), North (713 sqm/transaction), and Nabatieh (651 sqm/transaction) governorates.
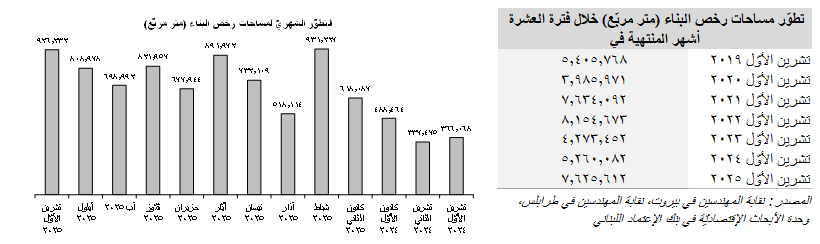
إستناداً إلى إحصاءات نقابة المهندسين، بلغت مساحات البناء المرخَّصة في لبنان، والتي تعكس توقّعات مستوى العرض في القطاع العقاري، 926،232 متر مربّع في شهر تشرين الأوّل 2025 مقارنةً ب808،978 متر مربّع في شهر أيلول و698،992 متر مربّع في شهر آب. إنّ أرقام شهر تشرين الأول تمثّل أعلى مستوى لمساحات البناء المرخّصة منذ شهر أيّار 2022 )عندما كان هنالك طلب كبير على رخص البناء قبل تعديل سعر الصرف الرسمي) وهو ما يعكس مستوى قوي من العرض المستقبلي في ظلّ تحسّن الظروف الأمنيّة والإقتصاديّة. أمّا على صعيدٍ تراكمي، فقد إرتفعت مساحات البناء المرخَّصة بنسبة سنويّة بلغت 44.97% خلال الأشهر العشرة الأولى من العام 2025 إلى حوالي 7.62 مليون متر مربّع مقارنةً بحوالي 5.26 مليون متر مربّع في الفترة نفسها من العام السابق. يظهر التطوّر الشهري لمساحات البناء المرخّصة تقلّبات عديدة خلال الفترة الممتدّة بين شهريّ تشرين الأوّل 2024 وتشرين الأوّل 2025 كما هو مبيّن في البيان التالي:
أمّا بالنسبة للتوزيع الجغرافي لرخص البناء، فقد تفوّقت محافظة جبل لبنان على المناطق الأخرى حيث بلغت حصّتها من مساحات البناء المرخَّصة 2.86 مليون متر مربّع (37.48%)، تلتها محافظة الشمال (1.62 مليون متر مربّع <21.29%>)، والجنوب (1.40 مليون متر مربّع <18.37%>)، والبقاع (0.78 مليون متر مربّع <10.28%>)، والنبطيّة (0.63 مليون متر مربّع <8.26%>)، وبيروت (0.33 مليون متر مربّع <4.32%>).
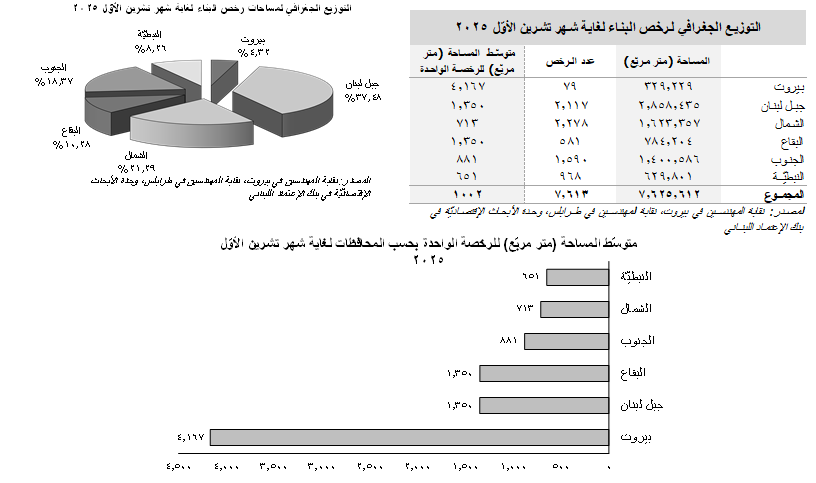
وقد حظيت محافظة بيروت على أعلى معدّل إستثمار للرخصة الواحدة، والذي وصل إلى 4،167 متر مربّع حتّى شهر تشرين الأوّل 2025، تبعتها كلٌّ من محافظة جبل لبنان (1،350 متر مربّع للرخصة الواحدة)، والبقاع (1،350 متر مربّع للرخصة الواحدة)، والجنوب (881 متر مربّع للرخصة الواحدة)، والشمال (713 متر مربّع للرخصة الواحدة)، والنبطيّة (651 متر مربّع للرخصة الواحدة).
